
What Is a Candlestick Chart?
A candlestick chart is a tool used in financial analysis to show the highest, lowest, opening, and closing prices of a stock or other security for a specific time period. Each “candlestick” on the chart shows one time period, like a day or an hour, and visually represents how the price moved during that time.
candlesticks are formed using the open, high, low and close of the chosen time frame.

1. Components of a Candlestick
Body: The thick part of the candlestick, which represents the range between the opening and closing prices.
- If the close is above the open, we can say that the candlestick is bullish which means that the market is rising in this period of time. Bullish candlesticks are always displayed as white candlestick
- If the close is below the open, we can say that the candlestick is bearish which indicates that the market is falling in this session. Bearish candles are always displayed as black candlesticks .
You can find different colors used to differentiate between bullish and bearish candlesticks.
- The filled part of the candlestick is called the real body.
- The thin lines poking above and below the body are called shadows.
- The top of the upper shadow is the high
- The bottom of the lower shadow is the low.
Wicks(Shadows): The thin lines above and below the body, indicating the highest and lowest prices during the period.
- Upper wick: The high price for the period.
- Lower wick: The low price for the period.

Long Vs Short

Long bodies refer to strong buying or selling pressure, if there is a candlestick in which the close is above the open with a long body, this indicates that buyers are stronger and they are taking control of the
market during this period of time.
if there is a bearish candlestick in which the open is above the close with a long body, this means that the selling pressure controls the market during this chosen time frame.
Long Body: Indicates strong buying or selling pressure. A long green body shows strong buying pressure, while a long red body shows strong selling pressure.
Short Body: Indicates less price movement and potential indecision in the market.
Long Shadows

The upper and lower shadows give us important information about the trading session.
- Upper shadows signify the session high
- Lower shadows signify the session low
Long Wicks: Suggest that prices moved significantly during the period but were pushed back to the opening or closing price level.
No Wicks: Suggests that the opening or closing price was also the high or low price for the period.
2. Major category of candlesticks are
2.1 Single Candlestick Patterns
- Doji
- Dragonfly Doji
- Gravestone Doji
- Hammer
- Inverted Hammer
- Hanging Man
- Shooting Star
- Marubozu
- Spinning Top
2.2 Two-Candle Patterns
- Bullish Engulfing
- Bearish Engulfing
- Bullish Harami
- Bearish Harami
- Piercing Pattern
- Dark Cloud Cover
- Tweezer Bottom
- Tweezer Top
- Inside Bar
2.3 Three-Candle Patterns
- Morning Star
- Evening Star
- Three White Soldiers
- Three Black Crows
- Three Inside Up
- Three Inside Down
1.Doji Candlestick
When doji candlestick forms, it indicates that the market opens and closes at the same price. This means there is equality and indecision between buyers and sellers, with no one controlling the market.
This signal means that the market didn’t decide which direction will take. When this pattern occurs in an uptrend or a downtrend, it indicates that the market is likely to reverse.
1.1 Structure:
A Doji has a very small or almost zero real body, meaning the Open and Close prices are nearly the same. It can have upper and lower wicks of different lengths.

1.2. Formation:
A Doji forms when buyers and sellers fight during the trading session, but neither side is able to gain clear control. The price may move significantly during the session but eventually closes near its opening price.
1.3 Psychology:
The Doji represents indecision and uncertainty in the market.
- Buyers tried to push the price higher.
- Sellers tried to push the price lower.
- Neither side was able to dominate.
Therefore, the market ends close to where it started.
1.4 Signal:
A Doji generally indicates indecision, not an automatic buy or sell signal.
Its importance depends heavily on its location and the preceding trend.
- After a strong uptrend : possible bullish-to-bearish reversal
- After a strong downtrend : possible bearish-to-bullish reversal
- During sideways movement : usually less significant
1.5 Example
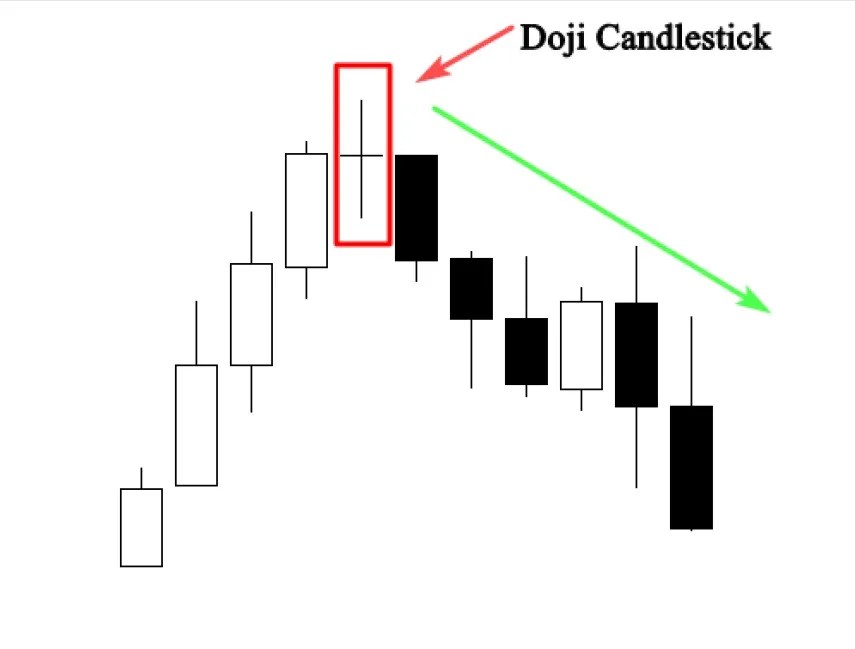
The chart above shows how the market changed direction after the formation of the doji candlestick.
The market was trending up, that means that buyers were in control of the market.
The formation of the doji candlestick indicates that buyers are unable to keep price higher, and sellers push prices back to the opening price
2.Dragonfly Doji Candlestick
The Dragonfly Doji is a bullish candlestick pattern which is formed when the open high and close are the same or about the same price. what characterizes the dragonfly Doji is the long lower tail that shows the resistance of buyers and their attempt to push the market up.

The long lower tail suggests that the forces of supply and demand are nearing a balance and that the direction of the trend may be nearing a major turning point.
2.1Structure:
A Dragonfly Doji has:
- Open and Close near the same price
- Very long lower shadow
- Little or no upper shadow
- The candle looks like a “T”
2.2 Formation:
The price initially moves strongly downward, but buyers enter the market and push the price back up. By the end of the session, the price closes near the opening price.
2.3 Psychology:
The long lower wick shows that sellers were initially in control, pushing the price significantly lower. However, buyers eventually absorbed the selling pressure and pushed the price back toward the opening level. This2.4 indicates that buyers are becoming stronger and sellers are losing control.
2.4 Signal:
A Dragonfly Doji can indicate a potential bullish reversal, particularly after a strong downtrend. However, it is not automatically a buy signal. Its reliability depends on where it appears and what happens afterward.
2.5 Example

The formation of the dragonfly Doji with the long lower tail shows us that there is a high buying pressure in the area .When it occurs in a downtrend, it is interpreted as a bullish reversal signal.
The chart can be divided into three stages:
Downtrend ↓ → Dragonfly Doji → Bullish reversal ↑
On the left side, the stock is clearly moving downward. Sellers are continuously pushing the price lower. Then, near the bottom, the red box highlights the Dragonfly Doji. After that candle, the price begins moving upward, which is shown by the green arrow.
3. Gravestone Doji Candlestick
The Gravestone Doji is the bearish version of the dragonfly Doji, it is formed when the open and close are the same or about the same price . The formation of the long upper tail is an indication that the market is testing a powerful supply or resistance area.

This pattern indicates that while buyers were able to push prices well above the open . Later in the day sellers back in the market pushing the price back down.
This is interpreted as a sign that bulls are losing their momentum and the market is ready for a reversal
3.1 Structure:
A Gravestone Doji has:
- Very small or almost zero real body
- Long upper shadow
- Little or no lower shadow
- Open and Close are near the low of the candle
- It generally looks like an inverted “T”
3.2 Formation:
The price initially moves strongly upward, but sellers enter at higher levels and push the price back down. By the end of the candle, the price closes near the opening/low price.
So the basic formation is:
Price rises strongly → Sellers enter → Price falls back → Close near Open
3.3 Psychology
The Gravestone Doji represents a battle between buyers and sellers.
Initially:
Buyers: Push the price significantly higher.
Sellers: Enter at higher prices and aggressively reject those higher levels.
3.4 Signal
A Gravestone Doji can indicate a potential bearish reversal, particularly when it appears after a strong uptrend.However, it should not be treated as an automatic SELL signal.
For example:
Strong Uptrend → Gravestone Doji → Bearish Confirmation
This is much stronger than simply seeing a Gravestone Doji.
3.5 Example

The formation of this candlestick pattern indicates that buyers are no longer in control of the market. For this pattern to be reliable, it must occur near a resistance level .
4. Hammer Candlestick
The Hammer Candlestick Pattern is one of the most powerful bullish reversal patterns in technical analysis. It appears after a downtrend and signals that sellers are losing control while buyers are starting to take over.
The Hammer candlestick forms when the open, high, and close are nearly the same, with a long lower shadow signaling a bullish rejection by buyers aiming to drive the market higher.
A hammer indicates that although sellers pushed prices significantly lower during the trading session, buyers managed to regain control and close the price near the opening level.
4.1 Structure:
A valid hammer candlestick has the following characteristics:
- Small real body near the top of the candle
- Long lower shadow (at least 2 times the body size)
- Little or no upper shadow
- Appears after a downtrend

The hammer is a reversal candlestick pattern when it occurs at the bottom of a downtrend .
- Open Price: ₹100
- Low Price: ₹90
- Close Price: ₹101
During the day, sellers pushed the stock down to ₹90. However, buyers entered aggressively and pushed the price back up to ₹101 before the market closed.
This shows strong buying interest at lower levels.
4.2 Characteristics of a Hammer Candlestick:
- Shape: The hammer has a small body with a long lower shadow (at least twice the length of the body). The upper shadow is either very small or nonexistent.
- Color: The color of the hammer’s body can be either green (bullish) or red (bearish). However, a green hammer is often considered more bullish because it indicates a stronger buying pressure.
- Position in Trend: The hammer must appear after a downtrend. This is essential because the pattern is only considered a reversal signal when it follows a decline.
4.3 Psychology
Bullish Reversal Signal: The long lower shadow indicates that sellers pushed the price down significantly during the trading session, but strong buying pressure ultimately drove the price back up near the opening level. This suggests that buyers are starting to gain control.
4.4 Example

As you can see the market was trending down, the formation of the hammer (pin bar) was a significant reversal pattern.
The long shadow represents the high buying pressure from this point. Sellers was trying to push the market lower, but in that level the buying power was more powerful than the selling pressure which results in a trend reversal.
5.Inverted Hammer
The Inverted Hammer candlestick pattern is a bullish reversal pattern that typically forms at the bottom of a downtrend, indicating a potential reversal in trend. It resembles the Hammer pattern but with the shadows reversed.

5.1 Structure:
Small real body
- The body is relatively small.
- It can be green (bullish) or red (bearish).
- The color is less important than the overall shape.
Long upper shadow
- The upper wick should be at least about 2× the size of the real body.
- It shows that buyers pushed the price significantly higher during the candle.
Very small or no lower shadow
- The candle should have little lower wick.
- Ideally, the low is close to the open/close area.
5.2 Characteristics:
- Shape: The Inverted Hammer has a small body at the lower end of the trading range with a long upper shadow (at least twice the length of the body). The lower shadow is either very small or nonexistent.
- Color: The body of the Inverted Hammer can be either green (bullish) or red (bearish), but the color is less significant than the overall shape. A green body is often considered slightly more bullish.
5.3 Psychology:
Bullish Reversal Signal: The long upper shadow indicates that buyers tried to push the price higher during the trading session, but they were met with selling pressure that brought the price back down near the opening level. Despite this, the presence of buying pressure suggests that bulls may start gaining control, potentially leading to a reversal.
Phase 1: Fear Dominates (Opening)
- The candle opens, and the overall sentiment is still negative
- Most traders expect price to keep falling
- Sellers are confident
Phase 2: Sudden Buying Pressure (During the Candle)
- Out of nowhere, buyers step in aggressively
- Price shoots up strongly (this creates the long upper wick)
Now something interesting happens:
- Short sellers start getting nervous
- Some traders think: “Is the trend reversing?”
Phase 3: Sellers Fight Back (Closing)
Price is pushed back down near the opening level
Sellers try to regain control
Shape resembles an inverted hammer
- Small body at the bottom.
- Long wick extending upward.
5.3 Example:

if you see the above chart shows that the market began the day by gapping down. “Prices increased until encountering resistance and supply at the daily high.
Support Levels: The Inverted Hammer occurs near significant support levels on the price chart. These levels act as barriers where buyers are more likely to emerge and defend against further downward movement.
Note:- Please avoid trading based solely on candlestick patterns. Instead, confirm the candlestick signals with support and resistance levels, as these patterns are more reliable when they occur near key levels
6. Hanging Man Candlestick
A Hanging Man is a single-candle bearish reversal warning pattern that usually appears after an uptrend.
It looks similar to a Hammer, but the location is different:
- Hammer → appears after a downtrend → potentially bullish
- Hanging Man → appears after an uptrend → potentially bearish

6.2. Structure
The Hanging Man has:
- Small real body at the top.
- Long lower shadow/wick, generally at least 2× the size of the body.
- Very small or no upper shadow.
- It can be green or red, although a red/bearish candle can provide a stronger warning.
6.3 Psychology
During the Hanging Man candle:
1. Sellers suddenly become aggressive
They push the price significantly lower, creating the long lower wick.
2. Buyers recover the price
Buyers step in and push the price back toward the opening/closing area.
3. But something has changed
Even though buyers recovered the price, the fact that sellers were able to push the price sharply lower shows that selling pressure is starting to appear.
6.4 Example
7. Shooting Star Candlestick
A Shooting Star is a single-candle bearish reversal warning pattern that typically appears after an uptrend.
It shows that buyers pushed the price significantly higher during the session, but sellers came in strongly and pushed the price back near the opening level.

7.2. Structure
A proper Shooting Star generally has:
- Small real body near the bottom of the candle.
- Long upper shadow, ideally at least 2× the size of the body.
- Little or no lower shadow.
- The candle can be red or green.
- A red/bearish body is generally considered stronger, but the shape and location are more important than the color.
7.3 Psychology
Step 1 — Buyers take control
Buyers push the stock sharply higher.
Step 2 — Sellers enter
At higher prices, sellers become aggressive.
Step 3 — Buyers lose control
Sellers push the price back down toward the opening/closing area.
Step 4 — Warning
The long upper wick shows that the higher prices were rejected.
7.4 Example:
8. Spinning Top Candlestick
A spinning top candlestick is a candlestick pattern in technical analysis that signals market indecision or uncertainty. It features a small real body with relatively long upper and lower shadows.

8.1 Structure:
A Spinning Top is a candlestick that shows indecision between buyers and sellers.
1.Small Real Body
- The opening price and closing price are relatively close.
- The body can be green or red.
- The body is usually much smaller than the overall candle range.
2. Upper Shadow
- It has an upper wick/shadow.
- This shows that buyers pushed the price higher during the session.
3. Lower Shadow
- It also has a lower wick/shadow.
- This shows that sellers pushed the price lower during the session.
4. Similar-Sized Shadows
- Ideally, the upper and lower shadows are reasonably balanced.
- They don’t have to be exactly equal.
8.2 Psychology
Indecision: The spinning top suggests that there is a balance between supply and demand, with neither bulls nor bears able to dominate the market.
Potential Reversal: While it doesn’t always indicate a reversal, a spinning top can be seen near the end of an uptrend or downtrend as a sign that the current trend may be losing momentum, potentially leading to a reversal.
8.3 Bullish Spinning Top Example
A bullish spinning top pattern that typically appears after a Strong downtrend and indicates potential indecision in the market, which could be a precursor to a reversal from bearish to bullish sentiment . its more effective near support and demand zone .

In the example above, the sellers were driving the price lower. However, the appearance of a spinning top candlestick indicates that the sellers are losing momentum, and buyers are beginning to open positions. Following this, the price found support and moved upward.
A bullish spinning top is a candlestick pattern that suggests indecision in the market but, in certain contexts, can signal a potential reversal from a downtrend to an uptrend.
8.4 Bearish Spinning Top Example:
A bearish spinning top pattern that typically appears after a Strong uptrend and indicates potential indecision in the market, which could be a precursor to a reversal from bearish to bullish sentiment . its more effective near resistance and supply zone.

In the example above, the buyers were driving the price higher. However, the appearance of a spinning top candlestick indicates that the buyers are losing momentum, and sellers are beginning to open short positions. Following this, the price found resistance and moved downward.
A bearish spinning top is a candlestick pattern that indicates market indecision but can suggest a potential reversal from an uptrend to a downtrend. Like the bullish spinning top, the bearish version shows that neither buyers nor sellers are fully in control. However, when it appears after an uptrend, it can signal that the bullish momentum is weakening and that a reversal may be on the horizon.
2 Comments
zoritoler imol
hello!,I like your writing very a lot! share we communicate extra approximately your article on AOL? I need an expert on this area to solve my problem. May be that’s you! Having a look ahead to peer you.
binance sign up
Thanks for sharing. I read many of your blog posts, cool, your blog is very good.